Sensex indeed gapped on the very first day of the week (3rd gap-up action), which proved to be Exhaustion Gap within the next three trading sessions, as argued. By Thursday, down 1314 points from the high of 10945, the Index had closed this gap, losing all that it gained during the first three days of the week. With its high at 10945, Sensex had marginally overshot our target area mentioned at 10260-10787. Nifty, however, was well within the equivalent target levels.
Remember, once we see a 3rd or 4th gap-up in any move, its always better to be cautious, as technical position reaches an over-bought zone.

This turned out to be a nice 42% rally in just 6 trading sessions, and was the strongest rally so far since ‘Jan. It not only proved my contention for a short-term reversal, but also generated decent profits under the circumstances.
Remember, however, profits would have been trimmed or even disappeared if we did not have the profit-booking policy in place. I had, accordingly, advised a gradual profit-booking on long positions.
The current rally from 7697 10945 was the biggest and the fastest first segment of all bear market rallies since ‘Jan this year. Examine the previous rallies :
(1) The rally from 15332 (22nd Jan) to 18491 (29th Jan) was 21% in 5 days.
(2) The rally from 14677 (18th Mar) to 16452 (28th Mar) was 12% in 6 days.
(3) The rally from 12514 (16th Jul) to 15130 (24th Jul) was 21% in 6 days.
Time-wise, all the first segments lasted for about 5-6 day, and the same was the case for the current rally as well. Technically, we were able to enter as well as exit at the right time. It was purely on the basis of this time observation.
Price-wise, further examination of all the first segment of rallies since ‘Jan, shows that :
1. The ‘Jan rally got corrected by extent of 34%.
2. The ‘Mar rally was corrected by 64%.
3. The ‘Jul rally was corrected by 53%.
Remember, all of these correction levels are close to the Fibonacci ratios.
If the ensuing correction can hold to Fibonacci correction levels to the rally, then it can also turn out to be a medium term reversal. The 38.2% - 50% - 61.8% Fibonacci correction levels would work out to 9704 - 9322 – 8940, and the same have been marked on the chart.
Levels around 10116 can be seen as crucial in the immediate short term, as the same were the lows for last Monday/Tuesday. For opening further upsides, therefore, we need to see a strong action above 10116, and even a close above it. Such a follow-up would confirm the support at the 38.2% level to the 6-day rally from 7697 to 10945. This will be our bull case scenario.
In case the Sensex takes support at the Fibonacci correction levels marked, the short-term reversal we were expecting since last week, can turn out to be a medium-term reversal, which will not break last week’s low of 7697 till this year-end. Why ?
The following chart shows why. Movement since ‘Jan shows a particular pattern for the current bear phase, at least so far. Sensex shows falling segments lasting for 10 to 11 weeks, which are then followed by rallying segments lasting anything from 4 to 7 weeks.

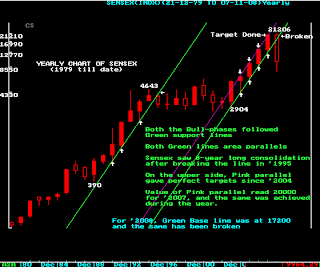
As per this phenomenon, we are likely to see the bottom at 7697 holding till the end of this year, resulting in a positive market for the next 4 to 7 weeks.Wave-structure wise, as I observed last week, the C leg from 15107 achieved 161.8% ratio to A (from 16632 to 12514). Time-wise, C consumed exactly the same time as A. Based on the 8-year cycle, since ‘Jan I have been arguing or a 55 to 58% cut from the top. Remember, in the previous 8-year cycle top during ‘1992-93, Sensex lost 56% from 4546 to 1980. In the next cycle top, the cut was almost 58% from 6150 in ‘2000 to 2594 in ‘2001. At the recent low of 7697, we have already seen a near 63% cut from the top of 21206. Prior to this, the wave-structure showed us an Extracting Triangle within the bear market rally from 12514 to 15107, which was marked by reduction in rising legs and increase in falling legs. Such a structure was already indicating a severe drop. From 15107, Sensex has been forming a “c” leg down. Though we normally expect 5-legged Impulse formation in “c” wave, the “c” of Triangle / Terminal / Diametric formations have Corrective label. I am, however, ssuming a channeled Complex Corrective in the current “c” simply because it is helping our trading strategies. Time-wise, I argued, “‘… such a phase would last for at least 13 months (beginning Jan’08), and may require consolidation thereafter, before the next bull phase can begin. As long as Sensex keeps on making lower highs, the bear phase continues.” However, while we wait for higher top higher bottom to form, a quick counter rally as a result of support at the current lows can give a short term trading opportunity.While the value target below 10K has been achieved, the time targets are still to be achieved. Remember, in technical analysis, both time and price forecasts must be achieved. Long-term investors better wait till then.


Source Vivek Bhai
